Chapter 1
Golang
Golang
golang 相关内容
golang 相关内容
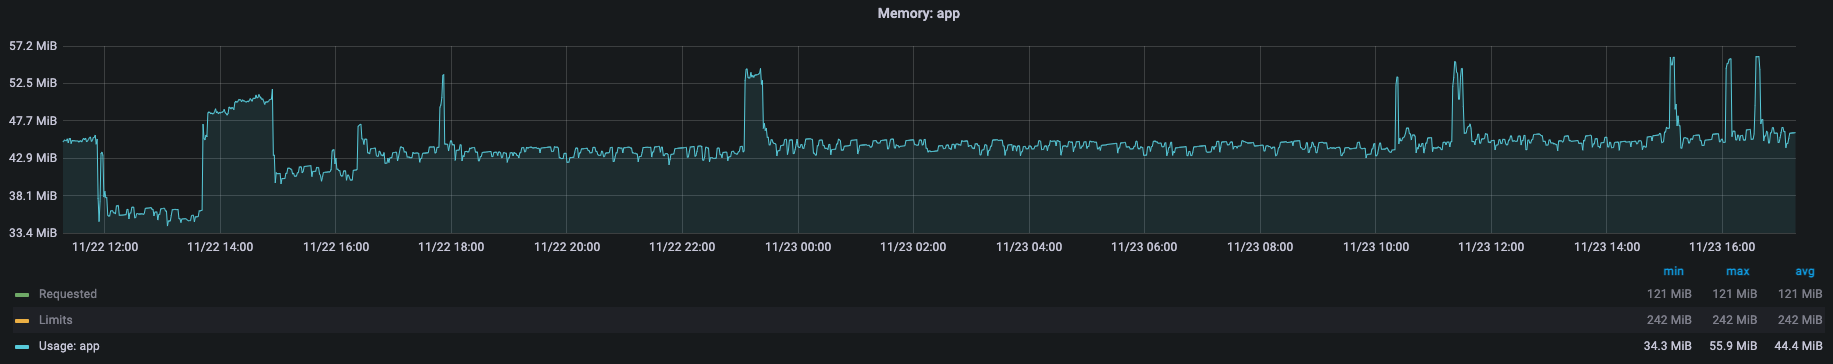
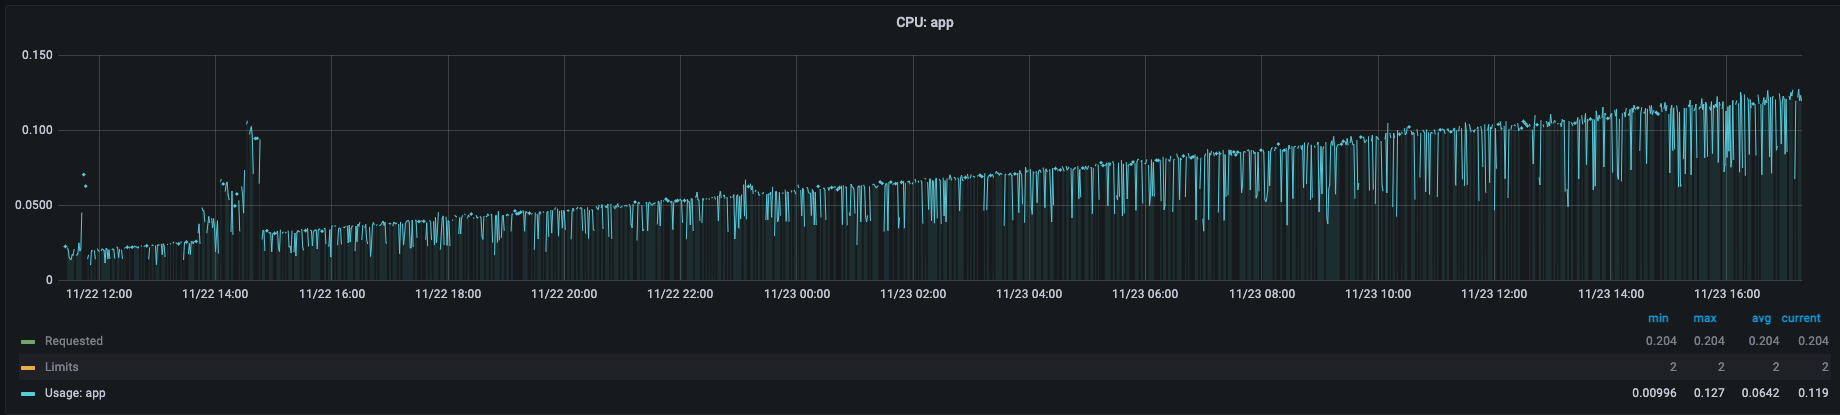
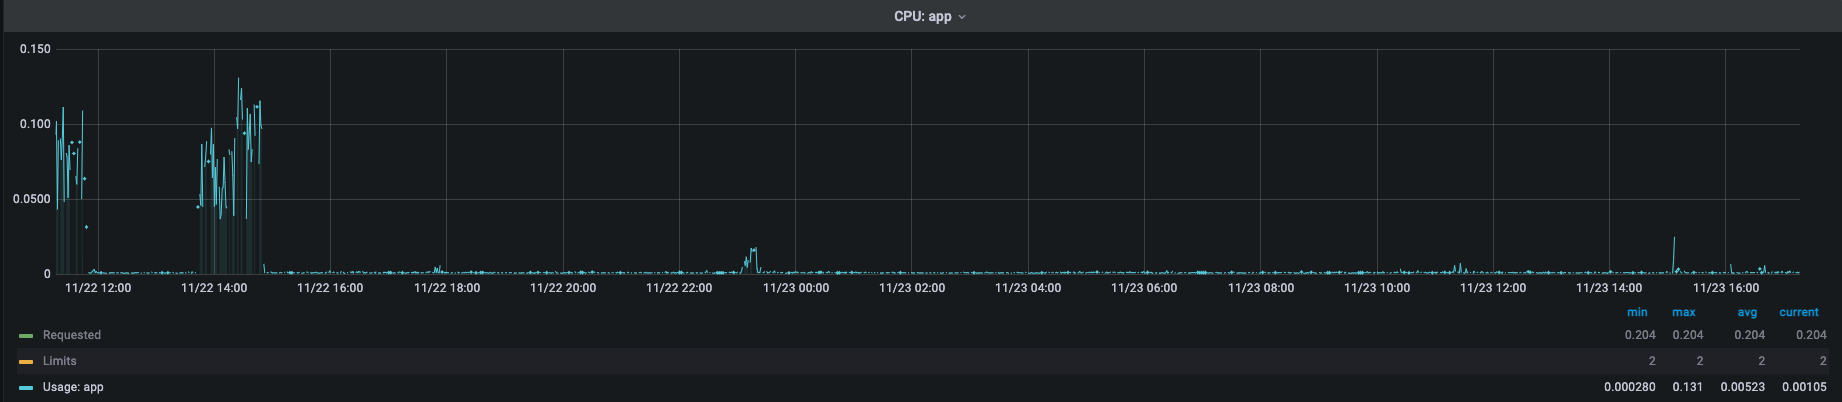
目前我们开发的流水线服务(pipeline)任务状态流转主要依赖drone-server往pipeline中推送,推送过程涉及drone-server -> webhook , webhook -> pipeline 两个过程,因为网络不完全可靠,因此会出现偶尔的状态丢失问题。现在通过pipeline 中定时向drone-server中查询build状态来弥补部分状态丢失问题。当任务开发完成投入预发环境运行时,观察监控发现: pipeline服务长时间运行后会出现cpu和内存缓慢增长的问题。
监控图表📈:
cpu:
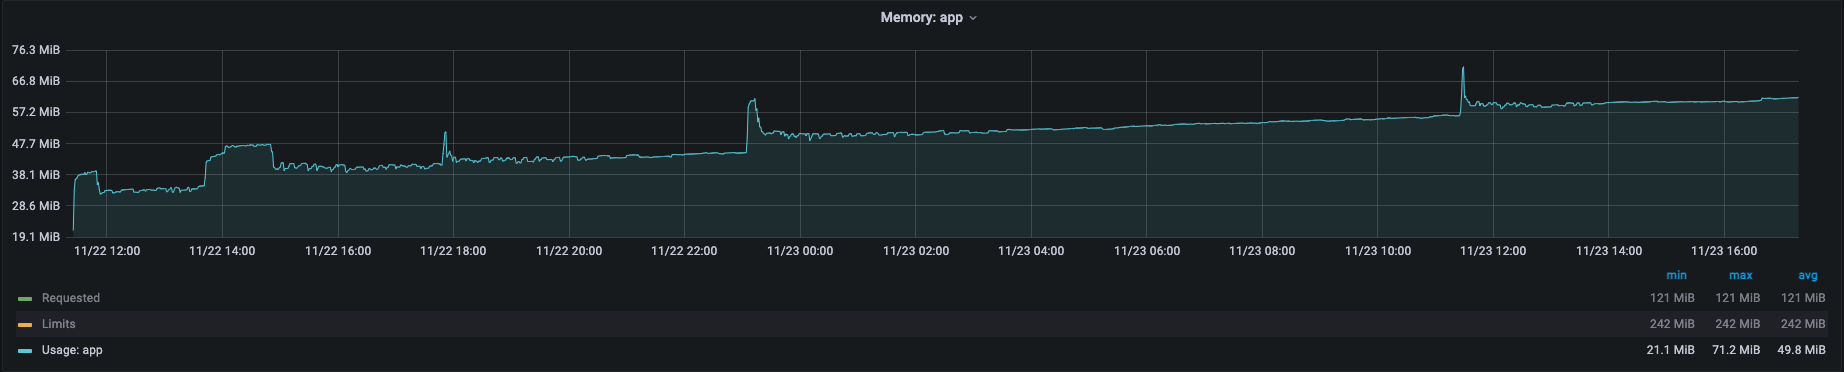
 mem:
mem:
pipeline go tool pprof https://xxx.com/debug/pprof/heap
Fetching profile over HTTP from https://xxx.com/debug/pprof/heap
Saved profile in /Users/zhou/pprof/pprof.pipeline.alloc_objects.alloc_space.inuse_objects.inuse_space.001.pb.gz
File: pipeline
Build ID: f5b549d19b3a22503c2410c78834ba394de7cfa6
Type: inuse_space
Time: Nov 22, 2022 at 9:11am (CST)
Entering interactive mode (type "help" for commands, "o" for options)
(pprof) top
Showing nodes accounting for 17358.76kB, 91.86% of 18897kB total
Showing top 10 nodes out of 125
flat flat% sum% cum cum%
8192.69kB 43.35% 43.35% 8192.69kB 43.35% time.NewTicker
2802.47kB 14.83% 58.18% 2802.47kB 14.83% ******/pipeline/vendor/github.com/klauspost/compress/zstd.encoderOptions.encoder
1805.17kB 9.55% 67.74% 1805.17kB 9.55% compress/flate.NewWriter
1025.80kB 5.43% 73.17% 1543.13kB 8.17% ******/pipeline/vendor/google.golang.org/protobuf/internal/filedesc.(*Message).unmarshalFull
768.26kB 4.07% 77.23% 768.26kB 4.07% syscall.copyenv
613.99kB 3.25% 80.48% 613.99kB 3.25% bytes.makeSlice
578.66kB 3.06% 83.54% 578.66kB 3.06% ******/pipeline/vendor/github.com/klauspost/compress/zstd.(*blockEnc).init
536.37kB 2.84% 86.38% 536.37kB 2.84% regexp/syntax.(*compiler).inst
518.02kB 2.74% 89.12% 518.02kB 2.74% ******/pipeline/vendor/github.com/beorn7/perks/quantile.newStream
517.33kB 2.74% 91.86% 517.33kB 2.74% ******/pipeline/vendor/google.golang.org/protobuf/internal/strs.(*Builder).AppendFullName
(pprof) webpipeline go tool pprof https://xxx.com/debug/pprof/profile\?second\=120
Fetching profile over HTTP from https://xxx.com/debug/pprof/profile?second=120
Saved profile in /Users/zhou/pprof/pprof.pipeline.samples.cpu.001.pb.gz
File: pipeline
Build ID: f5b549d19b3a22503c2410c78834ba394de7cfa6
Type: cpu
Time: Nov 22, 2022 at 9:15am (CST)
Duration: 30.10s, Total samples = 1.18s ( 3.92%)
Entering interactive mode (type "help" for commands, "o" for options)
(pprof) top
Showing nodes accounting for 1.13s, 95.76% of 1.18s total
Showing top 10 nodes out of 28
flat flat% sum% cum cum%
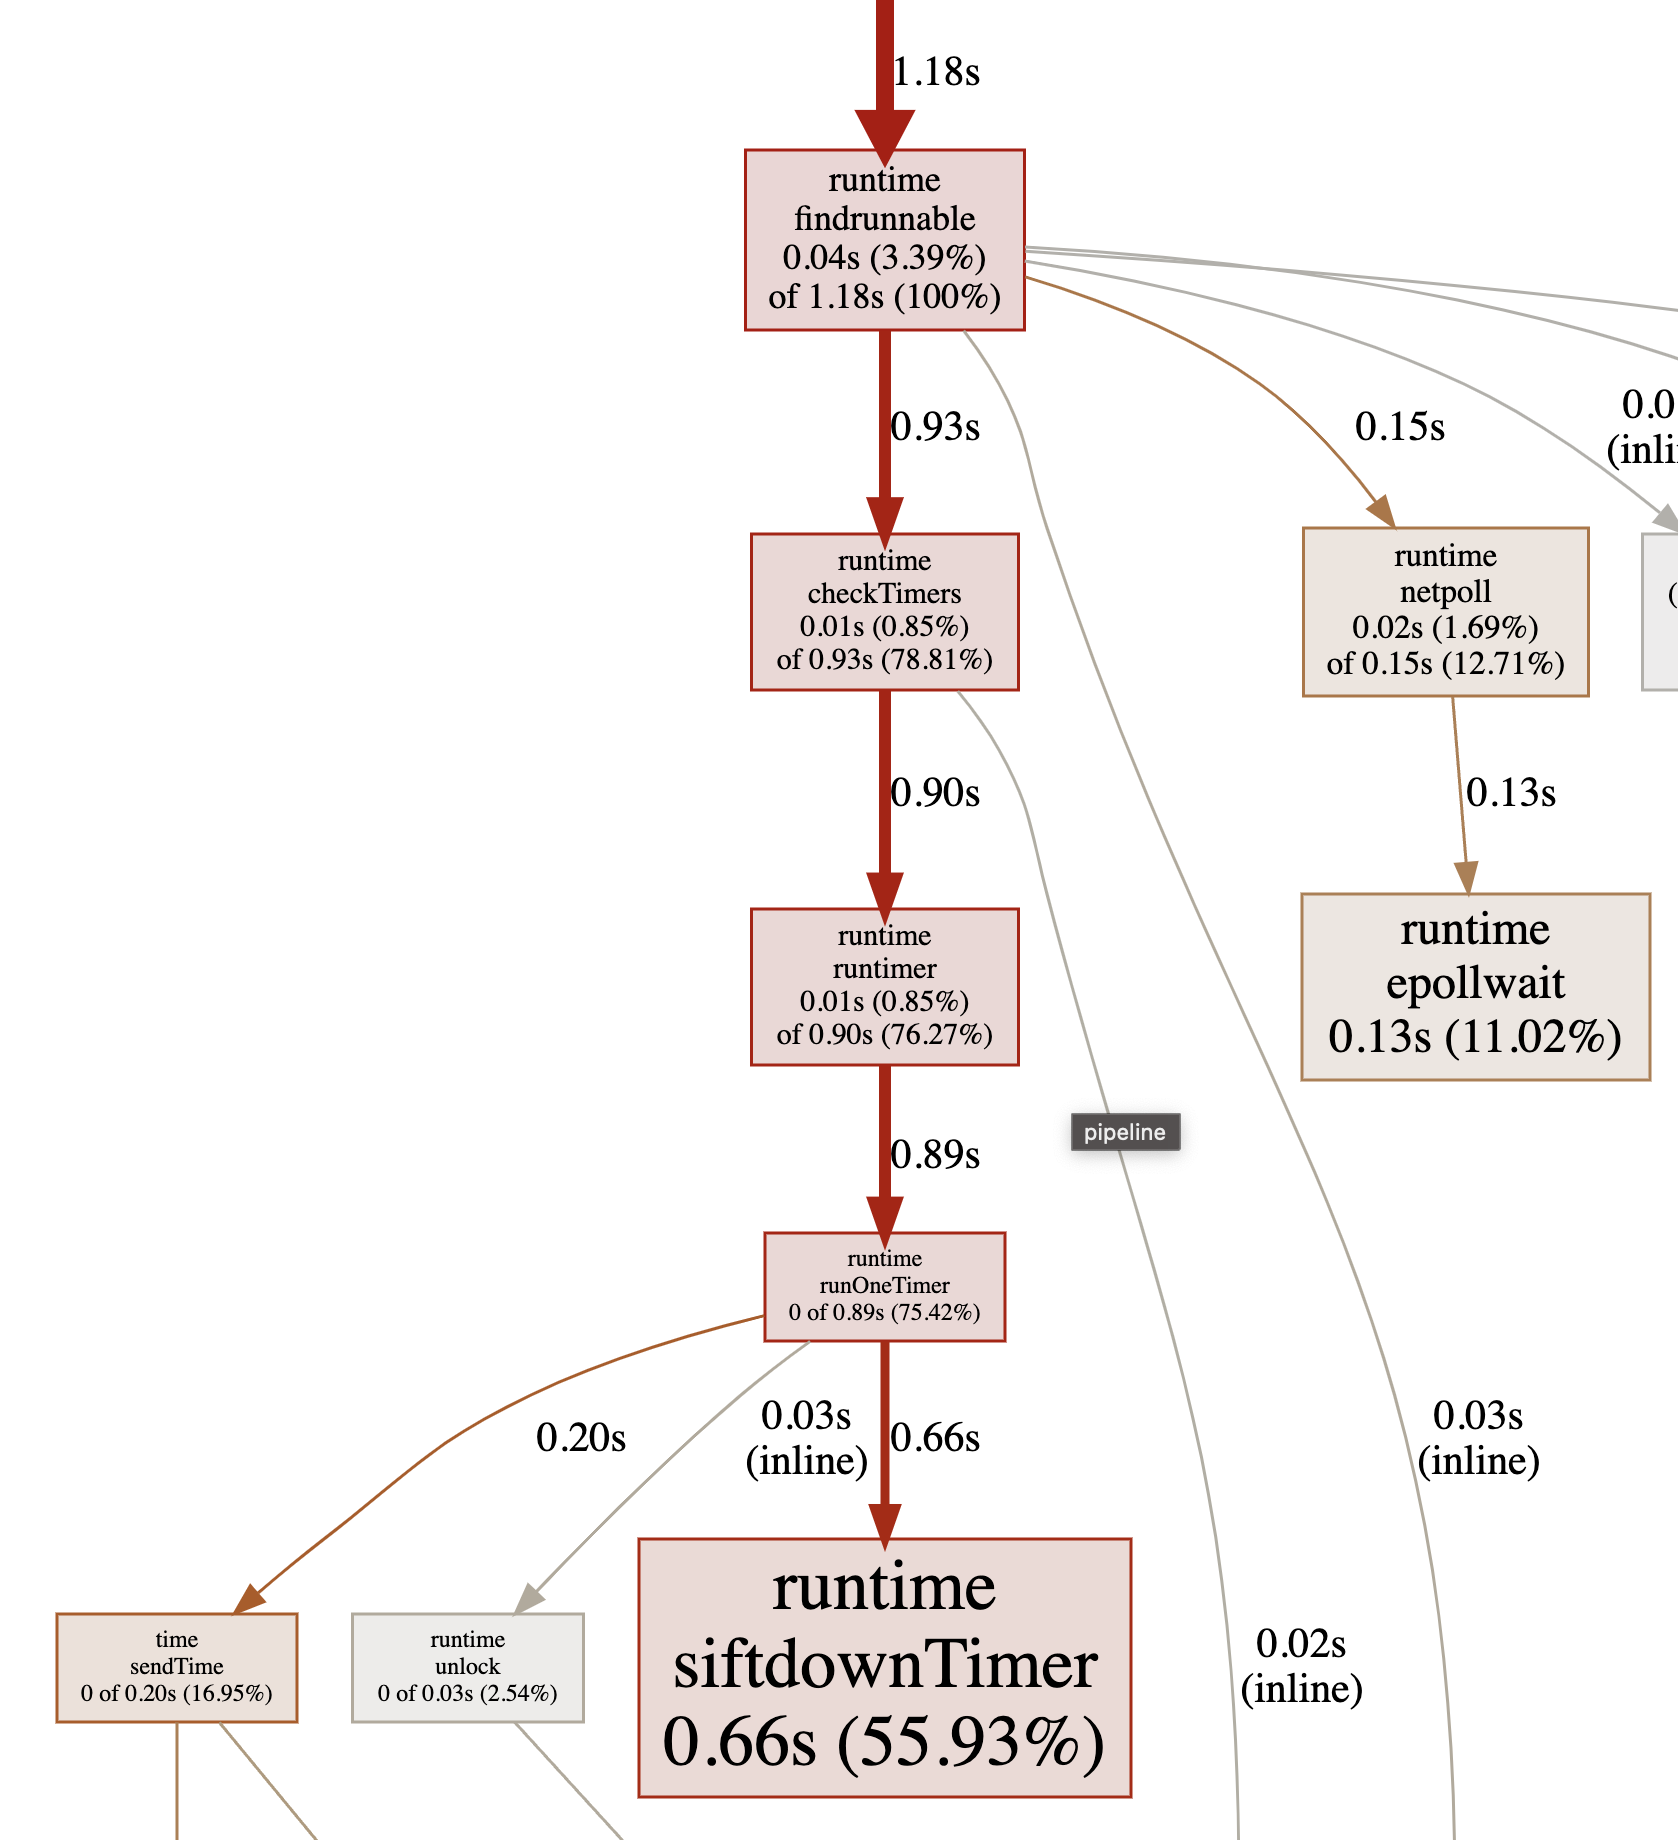
0.66s 55.93% 55.93% 0.66s 55.93% runtime.siftdownTimer
0.13s 11.02% 66.95% 0.13s 11.02% runtime.epollwait
0.12s 10.17% 77.12% 0.13s 11.02% runtime.chansend
0.05s 4.24% 81.36% 0.07s 5.93% runtime.nanotime (inline)
0.05s 4.24% 85.59% 0.05s 4.24% runtime.walltime (inline)
0.04s 3.39% 88.98% 1.18s 100% runtime.findrunnable
0.03s 2.54% 91.53% 0.03s 2.54% runtime.unlock2
0.02s 1.69% 93.22% 0.02s 1.69% runtime.nanotime1
0.02s 1.69% 94.92% 0.15s 12.71% runtime.netpoll
0.01s 0.85% 95.76% 0.01s 0.85% runtime.(*randomEnum).done (inline)
(pprof) web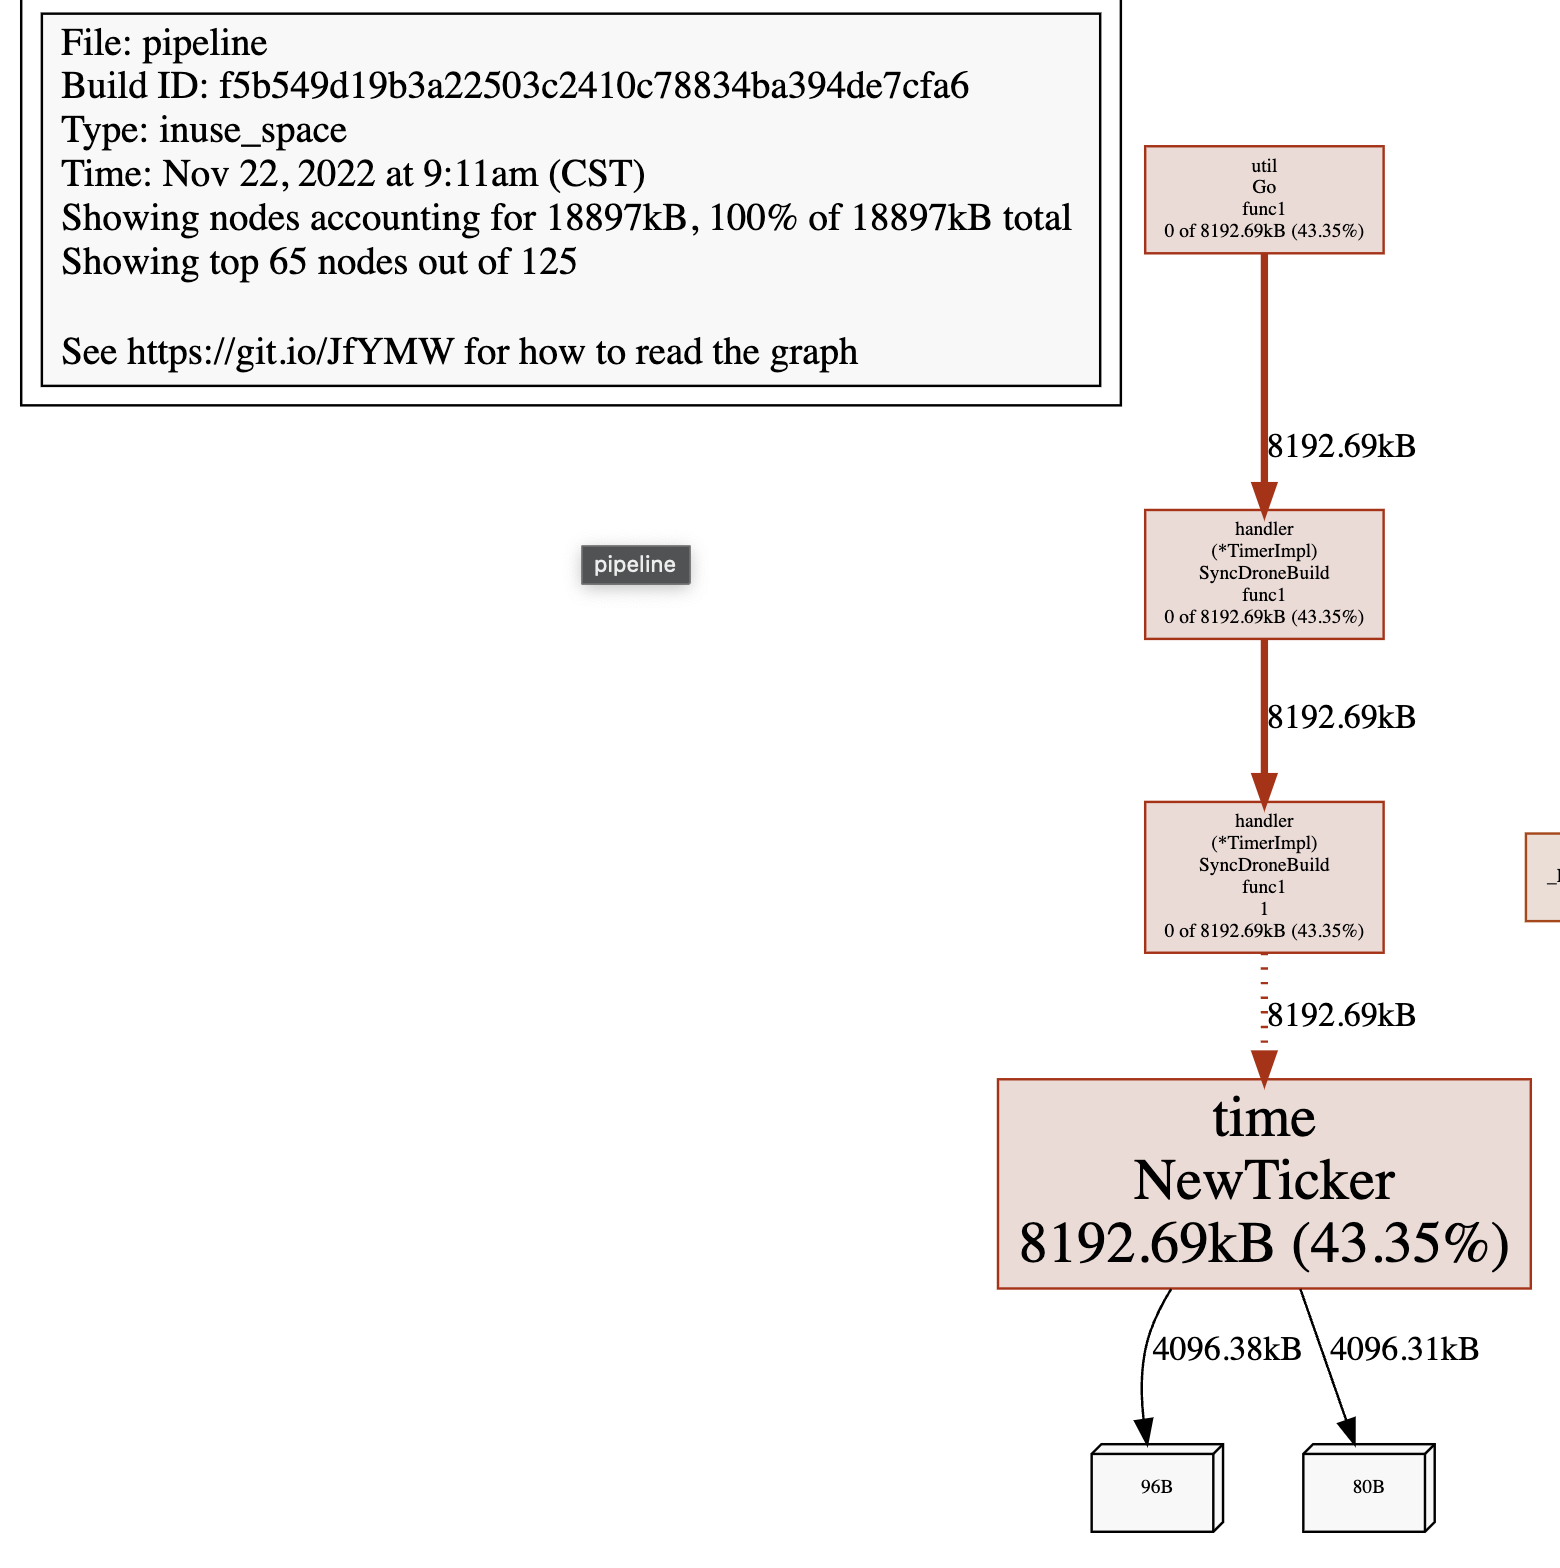
util.Go(func() {
   func(r *RM, ch chan int) {
      for {
         select {
         case <-time.Tick(time.Second):
            second := time.Now().Second()
            r.RLock()
            existed := r.m[second]
            r.RUnlock()
            if !existed {
               util.Go(func() {
                  t.readCache(second, ch)
               })
            }
            r.Lock()
            r.m[second] = true
            r.Unlock()
         }
      }
   }(r, ch)
})// Tick is a convenience wrapper for NewTicker providing access to the ticking
// channel only. While Tick is useful for clients that have no need to shut down
// the Ticker, be aware that without a way to shut it down the underlying
// Ticker cannot be recovered by the garbage collector; it "leaks".
// Unlike NewTicker, Tick will return nil if d <= 0.
func Tick(d Duration) <-chan Time {
if d <= 0 {
return nil
}
return NewTicker(d).C
}通过代码以及其注释可知,每调用一次Tick() 方法都会生成一个新的Ticker,并且没有办法被关闭,从而无法被gc回收导致内存泄漏。而在业务代码中,在循环调用time.Tick()方法进行倒计时,导致生成了大量的Ticker在内存中,使得应用资源使用率在不断得增加。
util.Go(func() {
   func(r *RM, ch chan int) {
      // 在循环开始前初始化一个ticker
      ticker := time.NewTicker(time.Second)
      for {
         select {
         case <-ticker.C:
            second := time.Now().Second()
            r.RLock()
            existed := r.m[second]
            r.RUnlock()
            if !existed {
               util.Go(func() {
                  t.readCache(second, ch)
               })
            }
            r.Lock()
            r.m[second] = true
            r.Unlock()
         }
      }
   }(r, ch)
})
在循环开始之前生成唯一一个ticker,从而避免使用time.Tick()的包装方法每次都生成新的ticker,因为这个倒计时存在于整个应用运行的生命周期,因此也无需关闭
cpu:
mem: